When I imagine a data world, I invariably think about the Matrix movies. This popular trilogy depicts a dystopian world run by an evil artificial intelligence (AI). Inside the matrix, the AI generated a fictitious world to distract the ‘simple’ human mind. From the outside, one could peer into the matrix, revealing the elaborate and complex machine data at its core. Immense amounts of this machine data permeated the world unnoticed by most. Yet a few, like Cypher (Joe Pantoliano), could ‘read’ the matrix by viewing the data. For him, perceptible patterns in the data coalesced together to assemble something meaningful.
Goal of a Data World
The goal of a data world is to build a 3D place where the imperceptible becomes perceptible. With datasets growing in size, dimension and complexity, summary statistics are only skin-deep. That is, we are judging a dataset by its outward appearance alone. A useful analogy is to think about Anscombe’s quartet within a 2D world [1,4]. This quartet of scatter plots depicts the shortcomings of summary statistics when evaluating data. Not until we see the plots, do we instantly perceive the divergent nature of the data.
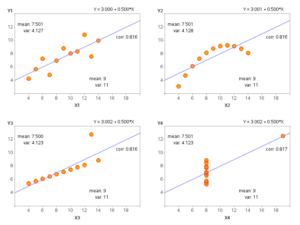 Courtesy of: http://robslink.com/SAS/democd67/anscombe_quartet.htm
Anscombe’s quartet reveals that the key assumptions made from summary statistics are false. Due to the nature of the data, a model using linear regression is inaccurate. But beyond the assumptions, it must be clear what your goal is. Exploring, analyzing, modeling and reporting are all common goals for a data analysis. As Anscombe’s quartet did in 2D, a data world provides a powerful discovery tool for 3D. One that allows us to glean deep insights in an explorative and iterative manner. If exploration is your goal, then transporting your data into a data world might be the answer.
Data Analyst Superpowers
Before diving in head first, the nature of the data must be well understood. As a data analyst, this is where a data world can give us superpowers like Neo. A holistic view of a dataset with millions of data points and hundreds of dimensions is not possible in 2D. This data analyst superpower will: a) help us to better comprehend the data, b) it will help to reveal the fallacy in our assumptions and c) it will show the inadequacy of our abstractions, e.g. mean.
Our new data analyst superpowers won’t stop there. An interactive data world can enable real-time transformations. A user immersed in this world could perform a gradient descent with the flick of the wrist. Segment the data into clusters based on eye-gaze [3]. Even do a principal component analysis (PCA) by the movement of their head. The operations you can perform on data within a data world can be quite elaborate. Our only limit will be our imagination.
The human imagination is amazing but we must remind ourselves of Occam’s Razor. The simplest solution with the least assumptions is generally the best solution. In particular, not all datasets are well suited for a data world analysis, nor are all goals, e.g. reporting. Our assumptions about the data and any biases about the problem we harbor, will determine when the data world operations would be able to glean insights, and when they would fail [2]. In other words, performing a data world analysis when it is not required is akin to choosing the complicated solution.
The Path Forward
Over the coming months, I will be exploring a thesis that visualizing data within a data world can reveal our false or hidden assumptions/biases while giving us powerful new abstractions that can refine our thinking. Much like Anscombe’s quartet did to display the restrictive limitations of simple summary statistics for the two-dimensional data-sets, data-worlds will reveal new insights not previously conceivable. Being able to visualize, manipulate and transform large complex datasets in a data world will invariably lead to that eureka moment we all seek.
My approach will be to study:
- Data World Visualization Techniques: how to display complex high-dimensional datasets in a 3D data world in an intuitive and insightful way [5] while investigating what datasets benefit from data world representation.
- Operators: what set of operations, manipulations and/or transformations are useful in a 3D data world and will lead to an efficient discovery of insights.
- Interactive Machine Learning: how embedding humans-in-the-middle of machine learning (ML) algorithms, surrounding them with immersive analytics, will lead to dramatic improvements in ML performance.
Throughout my research, I will pay special attention to: a) the curse of dimensionality, b) the no free lunch theorem phenomenon and c) techniques to the improve anomaly detection in time-varying datasets.
 Courtesy of: https://twitter.com/researchmark
Over the years I have spent thousands of hours labouring over data collected from physical and software systems. I dream of the day when I can immerse myself in that data. A day when I can avoid excessive time spent munging data. A day when I can glean relevant insights without weeks of preparation time. Just as Cypher could perceive the seemingly stochastic rhythms of the matrix from a computer monitor, a data world will give us an entirely new medium to perceive data. This will be true immersive analytics and is what we are striving to build. If you want to help us build this, I encourage you to reach out and we will explore the future of immersive analytics together.
References
[1] Visualization and Transformation of Data: http://www.upscale.utoronto.ca/GeneralInterest/Harrison/Visualisation/Visualisation.html
[2] Immersing Yourself in Your Data: http://www.astrobetter.com/blog/2013/03/25/immersing-yourself-in-your-data/
[3] The drawback of Kmeans: http://stats.stackexchange.com/questions/133656/how-to-understand-the-drawbacks-of-k-means
[4] Anomaly Detection, A survey: http://cucis.ece.northwestern.edu/projects/DMS/publications/AnomalyDetection.pdf
[5] Atlas in Silico: http://www.atlasinsilico.net/