Large global corporation seeks to augment their Data Science team with a visually impaired data scientist who has a proven record of sensing patterns in big data via audio and tactile analytics. The person will be responsible for developing a library of acoustic animations for use with our BI tool suite. Generous compensation and benefits package are offered.
You will probably not see this job ad currently posted. Why not? Audio and sonification technology is fairly mature and well researched. Is the application of sonification not effective for data analytics? Let’s explore this question?
Interplay of Seeing With Hearing
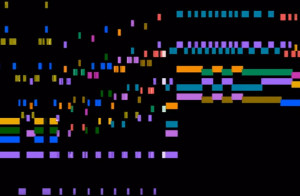
 A recent workshop by Prof. Edward Tufte began with visualizing Chopin music as created by Stephen Malinowski. This video conveys an insightful twist on this sonification issue. The visual surfaces the complexity and beauty of Chopin’s music. The rhythmic flow and changing moods are apparent in the music. Now, flip the situation backwards. You are presented with the sheet music and asked to hear the music. It is a talented person who can intuitively translate sheet music into a symphony. Is the comprehension of data analytics more analogous to seeing the sheet music or hearing the music?
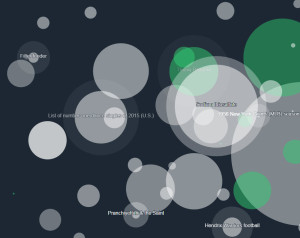
 My colleague, Neal McBurnett, suggested this excellent example of sonifying Wikipedia edit changes (text addition and deletions to items) by veteran Wikipendians Mahmoud Hashemi and Stephen LaPorte. You can sense the Wikipedia community hard at work! It feels mellow yet purposeful, like a gentle rain on a spring morning. Read about how this app is created.
Sensing = Seeing + Hearing + Touching + …
The point is that data visualization should mature into data sensing, where all senses are utilized properly (‘no chart junk!’) as technology enables. This implies the creation of an immersive multi-channel environment where a person can experience data analytics in action with deeper complexity and beauty.
The current generation of data visualization tools is awesome! Qlik, Tableau and others have built stable and affordable tools, which have opened the wonders of data analyses to a massive newer generation of data analysts.However, we have become over-reliant on visualization as the only channel for sensing the nature of data. The intent is to augment visualization from seeing to multi-channel sensing environments for data analysis. These analysis environments will therefore become more immersive by nature, regardless of whether one uses conventional 2D technology or emerging 3D virtual reality.
Data Sonification Research
A brief search of the research literature reveals hundreds of scholarly articles in recent years. Here are some highlights.
Kramer & others (2010) summarizes data sonification as of 2010, calling for interdisciplinary research and curriculum with the goal of securing NSF recognition. It is then citied by over 300 subsequent articles. An interesting search would be to identify the sonification research projects funded by NSF over the last five years. A solid definition emerges as: “Sonification is defined as the use of non-speech audio to convey information. More specifically, sonification is the transformation of data relations into perceived relations in an acoustic signal for the purposes of facilitating communication or interpretation.”
Starting with Hermann & Ritter (1999), Thomas Hermann established an amazing legacy of data sonification research focused on data analytics. This initial paper presents two acoustic data presentations: “Listening to particle dynamics in a data potential reveals information about the clustering of data. Listening to data sonograms gives an impression on results of a prior clustering analysis, e.g. on the class borders of a learned classification.” Hermann, Hunt and Neuhoff (2011) and Degara, Hunt and Hermann (2015) have emerged as reference pieces for sonification research.
As an example of many articles on specific sonification applications, Lunn and Hunt (2011) described the sonification of radio astronomy data as part of the Search for Extra-Terrestrial Intelligence (SETI), using the techniques of audification, parameter mapping and model-based sonification.
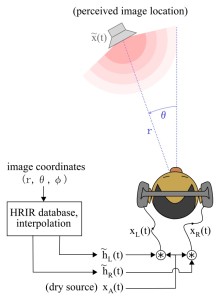
 Finally, Wolf, Bliner & Fiebrink (2015) is recent research that defines a new structure for sonification, called soundscapes (acoustic scenes). They apply their approach to twitter data using spatial sound. Listen to a collection of tweets during the 2014 Super Bowl here, which sounds like my backyard in summer.
Except for this paper, an area that is missing from this research is spatial sound, which has become an important feature of current VR technology. At CES 2015, I experienced the latest development of this feature in a prototype of the Oculus Rift. It was a significant (amazing!) improvement in the immersive experience. For instance, as you move a virtual data world, the concerto (cacophony) of data sounds can convey the sense of the overall nature (mood) of the data and especially the location of nearby data objects (which may be outside of your viewport).
Implications for IA
The bottom line is the IA innovators have no excuses for not incorporating sonification as an integral component of virtual data worlds. For each data objects created, one should ask: What should this object sound like? How should the nature of the data and the results of its analysis be rendered as sound? How will this sound blend with the sounds of nearby data objects? And, what is the best combination of seeing versus hearing for a specific application?
Here are several sonification categories that require exploration:
- Sound of individual datasets, in terms its structure (e.g., number of columns and rows), attribute/feature carnality (nominal, ordinal, interval, ratio), and initial descriptive analysis (clustering, PCA, SVM).
- Sound of time-varying features, such as stock prices over time.
- Sound of interaction during analysis, such as unique sounds for analysis routines along with indicators of successful completion.
- Sound of data analytic processing, such as gradient descent (global vs local optima), variance/bias tradeoffs, PCA projections (flipping axes), SVM dimensional reduction (column crunching), and neural network convergence.
- Sound of datasets merging, as in join, intersection and union operations.
- Sound of the ambient space, conveying a sense of harmony (or dissonance) in the data using spatial audio.
A Challenge
Here is a challenge: Develop an immersive data world using VR technology without a visual component, relying only on audio and tactile feedback. To a visually impaired person, the experience should be like exploring an unfamiliar house or wandering a backyard garden. In what ways would this discovery experience be different or even superior to that of a sighted person?
Let’s roll up our sleeves, and get to sonifying…
References
- Degara, Norberto, Andy Hunt, and Thomas Hermann. “Interactive Sonification [Guest editors’ introduction].” MultiMedia, IEEE 22.1 (2015): 20-23.

- Hermann, Thomas, and Helge Ritter. “Listen to your data: Model-based sonification for data analysis.” Advances in intelligent computing and multimedia systems 8 (1999): 189-194.

- Hermann, Thomas, Andy Hunt and John Neuhoff. “The Sonification Handbook.” Logo Publishing House (2011).

- Kramer, Gregory, et al. “Sonification report: Status of the field and research agenda.” (2010).

- Lunn, Paul and Hunt, Andy. “Listening to the invisible: Sonification as a tool for astronomical discovery.” in “Making visible the invisible: art, design and science in data visualization.” (2011).

- Wolf, KatieAnna E., Genna Gliner, and Rebecca Fiebrink. “A model for data-driven sonification using soundscapes.” Proc. IUI (to appear) (2015).

NOTE: Please comment at our LinkedIn group site, since the website is not yet configured to accept registrations.
– https://www.linkedin.com/groups/8344300/8344300-6072773921625624577
