Since posting a blog on The Master Algorithm book, I have been daydreaming about how immersive data worlds would visualize a next-gen machine learning algorithm searching for a cure for cancer. The problem is two-fold. First, we need to comprehend its logic through its many twists in processing. Second, we need to collaborate with its logic, giving hints at apt points and assuring validity of its outcomes, especially with regard to human values. Both aspects are mind boggling and crucial.
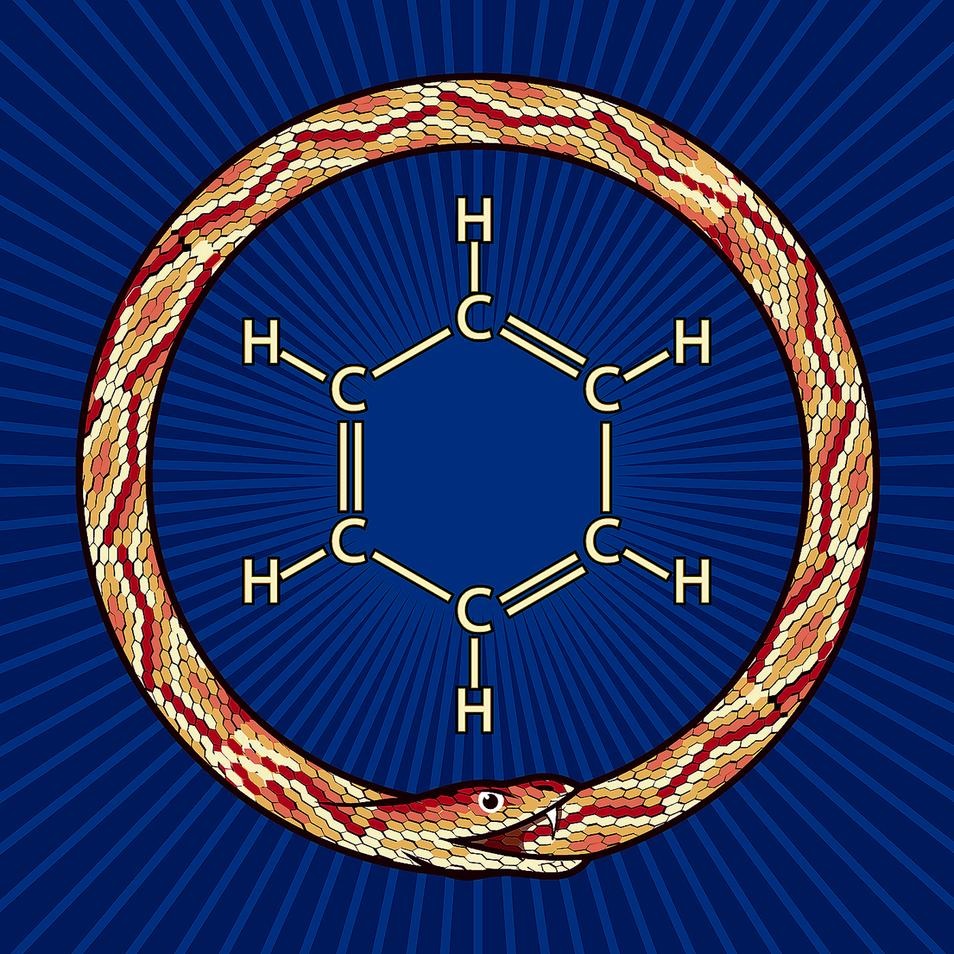 Welczek’s Universe [1] column entitled The Vision Thing [2] offers useful insights. He argues that simple visualizations that encapsulate complexity have been the key to unlocking mysteries in the sciences. He illustrates with a daydream in the 1850’s by August Kekulé in which he conceives of the benzene molecule as a ring, similar to a snake eating its tail. [3] He also noted that in 1948 Feynman proposed as a simple wiring diagram as a unifying visualization that distilled the structure of complex quantum wave equations [4]. Both illustrate how simple visualizations can encapsulate complexity in a human consumable form. Welczek concludes his column with…
In coping with vast and unfamiliar complexity, more than ever, we need to tap vision’s power – and to expand the intersection of art and science.
My take-away regarding immersive analytics is…
 Daydreaming is a useful method for humans to detached from everyday reality and to comprehend different and strange realities, which has led to momentous innovations. Everyday reality is often a hindrance to our ability to cope with complexity, like a fog that hampers the search for the essence of this complexity.
In a similar fashion, immersive data worlds could be a high-tech version of machine-assisted daydreaming. It could be a canvas upon which the essence of the complexities is rendered. These data worlds could mimic the physics of the problem space. Data objects within the data world would ‘naturally’ conform to this physics and guide us along fruitful solution paths. A person could be mentally transported into this data world which enables fluid interactivity with data objects and even collaboration with other persons.
The challenge will be to design simple visualizations (as multi-sensory interactive data objects) through which we can sense the essence of vast and unfamiliar complexities.
References
[1] Wall Street Journal. [link] Frank Wilczek is a theoretical physicist at MIT and Nobel laureate, who ponders “unified visions of nature”. [Wikipedia] And he is doing amazing work! [self-site] An earlier column What Would It Be Like to Walk Through the Mind is also relevant to immersive analytics. [link]
[2] Wilczek, How Visionaries in Visualization Moved Science Forward, WSJ, May 6, 2016 [link]
[3] Wikipedia, Benzene, May 10, 2016 [link] Note the long paragraph about Kekule’s daydream toward end of Discovery section.
[4] Wikipedia, Feynman Diagram, May 10, 2016 [link] This entry does not mention daydreaming in the invention of this diagram. However, as a Caltech student who was witness to Feynman’s stream-of-thinking physics lectures, I am highly confident that daydreaming played a significant role.